Post 5: Install a logging solution for a Kubernetes homelab


Introduction - EfK stack on/for Kubernetes
Observability is a function that allows developers and operators to identify problems where and when they happen across multi-node systems. Proper instrumentation enables you to aggregate metrics, traces, logs and events from a distributed system and correlate them across various application components and services, identifying complex interactions between elements and allowing you to troubleshoot performance issues, improve management, and optimize cloud native infrastructure and applications.
This article covers running a logging solution hosted on, and supporting Kubernetes.
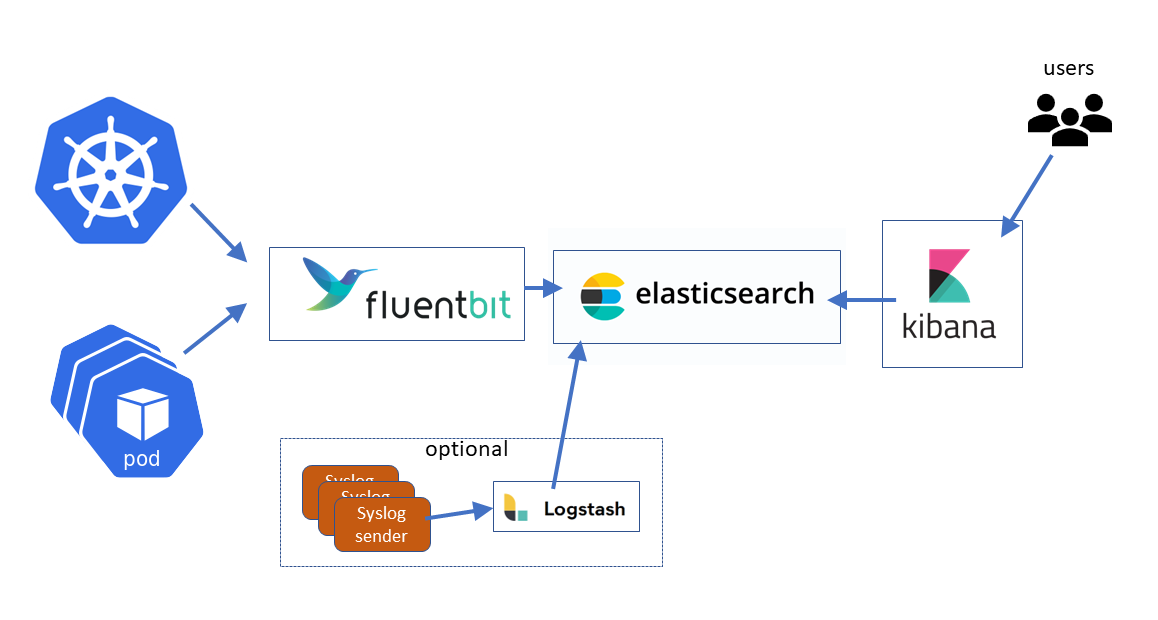
ELK is an acronym that describes a popular “stack” of open source components used to implement an n-tier logging solution with search, analytics and user interface. E=elasticsearch, L=Logstash, and K=Kibana. With Kubernetes it is often popular to swap out the L=Logstash component for f=fluentbit (aka EfK stack).
This substitution is popular because fluentbit is comparatively very light on resource demands (important because log collection elements run on every Kubernetes cluster node) and because it has a set of configurable input plugins that support gathering logs from Kubernetes itself plus the containers Kubernetes is hosting.
Install ElasticSearch and Kibana using a helm chart
The best practice is to use seven pods in the Elasticsearch cluster:
- Three master pods for managing the cluster.
- Two data pods for storing data and processing queries.
- Two client (or coordinating) pods for directing traffic. The “official” helm chart from elastic involves a multi-step process to do a horizontally scaled configuration like this so we are using the helm chart from bitnami instead.
Add the Bitnami helm repo if you don't already have it from a previous service installation:
helm repo add bitnami https://charts.bitnami.com/bitnami
helm repo update
This example assumes you have a storage class pre-defined, named silver, and have a service load balancer in place. Adjust the steps as needed.
# create namespace
kubectl create ns kube-logging

# install
helm install elasticsearch bitnami/elasticsearch -n kube-logging --set global.storageClass=silver,global.kibanaEnabled=true,service.type=LoadBalancer,kibana.service.type=LoadBalancer,master.replicas=3,coordinating.service.type=LoadBalancer
Install Fluentbit using a Carvel package
To feed logs from Kubernetes to the Elasticsearch, Kibana combo - fluentbit will be used. This will cover an install using the Carvel based package option built into Tanzu Community Edition. If you are on a Kubernetes distribution that does not support Carvel, then a fluent bit install using helm with similar settings should work.
First a yaml file is composed to set inputs, outputs, parsers and filters appropriate for Kubernetes log collection.
cat << EOF > fluent-bit-data-values.yaml
namespace: "kube-logging"
fluent_bit:
  config:
    service: |
      [Service]
        Flush         1
        Log_Level     info
        Daemon        off
        Parsers_File  parsers.conf
        HTTP_Server   On
        HTTP_Listen   0.0.0.0
        HTTP_Port     2020
    outputs: |
     [OUTPUT]
       Name            es
       Match           *
       Host            elasticsearch
       Port            9200
       Logstash_Format On
       Replace_Dots    On
       Retry_Limit     False
       Buffer_Size     64KB
       Suppress_Type_Name On

    inputs: |
      [INPUT]
        Name              tail
        Tag               kube.*
        Path              /var/log/containers/*.log
        Parser            cri
        DB                /var/log/flb_kube.db
        Mem_Buf_Limit     5MB
        Skip_Long_Lines   On
        Refresh_Interval  10

      [INPUT]
        Name                systemd
        Tag                 kube_systemd.*
        Path                /var/log/journal
        DB                  /var/log/flb_kube_systemd.db
        Systemd_Filter      _SYSTEMD_UNIT=kubelet.service
        Systemd_Filter      _SYSTEMD_UNIT=containerd.service
        Read_From_Tail      On
        Strip_Underscores   On

    filters: |
      [FILTER]
        Name                kubernetes
        Match               kube.*
        Kube_URL            https://kubernetes.default.svc:443
        Kube_CA_File        /var/run/secrets/kubernetes.io/serviceaccount/ca.crt
        Kube_Token_File     /var/run/secrets/kubernetes.io/serviceaccount/token
        Kube_Tag_Prefix     kube.var.log.containers.
        Merge_Log           On
        Merge_Log_Key       log_processed
        K8S-Logging.Parser  On
        K8S-Logging.Exclude On

    parsers: |
      # see https://github.com/fluent/fluent-bit/blob/v1.7.5/conf/parsers.conf
      [PARSER]
        Name   apache
        Format regex
        Regex  ^(?<host>[^ ]*) [^ ]* (?<user>[^ ]*) \[(?<time>[^\]]*)\] "(?<method>\S+)(?: +(?<path>[^\"]*?)(?: +\S*)?)?" (?<code>[^ ]*) (?<size>[^ ]*)(?: "(?<referer>[^\"]*)" "(?<agent>[^\"]*)")?$
        Time_Key time
        Time_Format %d/%b/%Y:%H:%M:%S %z

      [PARSER]
        Name   apache2
        Format regex
        Regex  ^(?<host>[^ ]*) [^ ]* (?<user>[^ ]*) \[(?<time>[^\]]*)\] "(?<method>\S+)(?: +(?<path>[^ ]*) +\S*)?" (?<code>[^ ]*) (?<size>[^ ]*)(?: "(?<referer>[^\"]*)" "(?<agent>[^\"]*)")?$
        Time_Key time
        Time_Format %d/%b/%Y:%H:%M:%S %z

      [PARSER]
        Name   apache_error
        Format regex
        Regex  ^\[[^ ]* (?<time>[^\]]*)\] \[(?<level>[^\]]*)\](?: \[pid (?<pid>[^\]]*)\])?( \[client (?<client>[^\]]*)\])? (?<message>.*)$

      [PARSER]
        Name   nginx
        Format regex
        Regex ^(?<remote>[^ ]*) (?<host>[^ ]*) (?<user>[^ ]*) \[(?<time>[^\]]*)\] "(?<method>\S+)(?: +(?<path>[^\"]*?)(?: +\S*)?)?" (?<code>[^ ]*) (?<size>[^ ]*)(?: "(?<referer>[^\"]*)" "(?<agent>[^\"]*)")?$
        Time_Key time
        Time_Format %d/%b/%Y:%H:%M:%S %z

      [PARSER]
        Name   json
        Format json
        Time_Key time
        Time_Format %d/%b/%Y:%H:%M:%S %z

      [PARSER]
        Name        docker
        Format      json
        Time_Key    time
        Time_Format %Y-%m-%dT%H:%M:%S.%L
        Time_Keep   On

      [PARSER]
        Name        docker-daemon
        Format      regex
        Regex       time="(?<time>[^ ]*)" level=(?<level>[^ ]*) msg="(?<msg>[^ ].*)"
        Time_Key    time
        Time_Format %Y-%m-%dT%H:%M:%S.%L
        Time_Keep   On

      [PARSER]
        # http://rubular.com/r/tjUt3Awgg4
        Name cri
        Format regex
        Regex ^(?<time>[^ ]+) (?<stream>stdout|stderr) (?<logtag>[^ ]*) (?<message>.*)$
        Time_Key    time
        Time_Format %Y-%m-%dT%H:%M:%S.%L%z

      [PARSER]
        Name        logfmt
        Format      logfmt

      [PARSER]
        Name        syslog-rfc5424
        Format      regex
        Regex       ^\<(?<pri>[0-9]{1,5})\>1 (?<time>[^ ]+) (?<host>[^ ]+) (?<ident>[^ ]+) (?<pid>[-0-9]+) (?<msgid>[^ ]+) (?<extradata>(\[(.*)\]|-)) (?<message>.+)$
        Time_Key    time
        Time_Format %Y-%m-%dT%H:%M:%S.%L
        Time_Keep   On

      [PARSER]
        Name        syslog-rfc3164-local
        Format      regex
        Regex       ^\<(?<pri>[0-9]+)\>(?<time>[^ ]* {1,2}[^ ]* [^ ]*) (?<ident>[a-zA-Z0-9_\/\.\-]*)(?:\[(?<pid>[0-9]+)\])?(?:[^\:]*\:)? *(?<message>.*)$
        Time_Key    time
        Time_Format %b %d %H:%M:%S
        Time_Keep   On

      [PARSER]
        Name        syslog-rfc3164
        Format      regex
        Regex       /^\<(?<pri>[0-9]+)\>(?<time>[^ ]* {1,2}[^ ]* [^ ]*) (?<host>[^ ]*) (?<ident>[a-zA-Z0-9_\/\.\-]*)(?:\[(?<pid>[0-9]+)\])?(?:[^\:]*\:)? *(?<message>.*)$/
        Time_Key    time
        Time_Format %b %d %H:%M:%S
        Time_Format %Y-%m-%dT%H:%M:%S.%L
        Time_Keep   On

      [PARSER]
        Name    kube-custom
        Format  regex
        Regex   (?<tag>[^.]+)?\.?(?<pod_name>[a-z0-9](?:[-a-z0-9]*[a-z0-9])?(?:\.[a-z0-9]([-a-z0-9]*[a-z0-9])?)*)_(?<namespace_name>[^_]+)_(?<container_name>.+)-(?<docker_id>[a-z0-9]{64})\.log$

    streams: ""
    plugins: ""

  daemonset:
    resources: { }
    podAnnotations: { }
    podLabels: { }
EOF
tanzu package install fluent-bit --package-name fluent-bit.community.tanzu.vmware.com --version 1.7.5 --namespace kube-logging --values-file fluent-bit-data-values.yamlExamine logs using the Kibana UI
Wait for all pods in the kube-logging namespace to start.
- Use
kubectl get svc -n kube-loggingto get the external load balanced ip of the kibana ui. - Open
http://<kibana ip>:5601in a browser - Dismiss the integration popup, click on the menu on the left, then discover
- Create a data view
- Set index pattern to logstash-* Note that the trailing asterisk will be added automatically
- Choose @timestamp from dropdown.
- Choose discover and select “last 15 minutes”. You should see log entries. Refer to the ElasticSearch/Kibana online docs or videos for more details on how this can be used